Opening Day: Designing an Injury Model for MLB

Into the Corn — Issue No. 1
Before the first pitch of the 2026 MLB Season, I want to show you how to think about one of the most important questions in baseball: which players are actually going to be available?
Not who is currently on the injured list — that’s just reading a transaction wire. The harder question is which players carry structural risk that the market hasn’t priced. Which teams look like contenders on paper but are one IL stint away from a very different season. Which win totals at the sportsbook are built on assumptions about player availability that the evidence doesn’t support.
To answer those questions, I built a model. This post explains how it works and what it found.
The Basic Idea
The model assigns every active 2026 MLB player a score from 1 to 99. A score of 1 means minimal documented injury risk. A score of 99 means the highest risk profile the model can generate. The middle numbers represent degrees of likelihood.
The Six Factors
IL Stint Severity — 30%
The most heavily weighted factor. How often has this player been on the injured list and how serious were those stints? A 10-day IL trip for a minor hamstring strain scores low. A 60-day IL placement for Tommy John surgery scores high. Multiple TJ surgeries or career-ending events approach the ceiling.
The 30% weight reflects the research consensus: past injury severity is the strongest single predictor of future injury among the factors I can measure with public data.
Availability Rate — 25%
Games played divided by games available, averaged across all post-2010 seasons. If a player is active for a full season but plays 110 of 162 games, that availability rate — 68% — tells you something important about how often he actually shows up. This is the most objective factor in the model because it measures outcomes rather than causes.
Recurrence — 20%
Whether the same body part or injury type has appeared more than once. A single ACL tear scores lower than two ACL tears. Chronic hamstring issues that recur across multiple seasons score high. The recurrence signal matters because published sports medicine research on return-to-play rates consistently shows that prior injury to the same structure is the strongest predictor of future injury to that structure.
Tommy John recurrence gets special treatment in the model. For pitchers who have had the surgery twice, the recurrence factor scores near the ceiling — because the published recurrence rate for a second TJ is severe enough to warrant it.
Position Load — 10%
A fixed multiplier based on sports medicine research on injury incidence by position. Catchers carry the highest structural load and score 85. Starting pitchers score 70. Shortstops and center fielders score 65. The scale runs down through the infield and outfield to first basemen and designated hitters at 30.
This factor doesn’t change based on the individual player — it reflects the structural demands of the position regardless of who plays it. A healthy catcher is still a catcher.
Age at Last IL Stint — 10%
When in the player’s aging curve did the most significant injury occur? An injury at 22 scores low on this factor — young players recover more elastically and a single event doesn’t necessarily predict a chronic pattern. The same injury at 36 scores near 90 — late-career injuries compound because recovery windows shrink and recurrence rates rise with age.
Pre-MLB Injury History — 5%
The most data-limited factor. For top prospects, pre-MLB surgical history is often publicly documented — labrum repairs, Tommy John surgeries, stress fractures before a player ever reaches the majors. That history is a real signal even if it’s a weak one.
Players from international pipelines — NPB, Cuban League — receive a neutral score of 25 on this factor because documentation is too sparse to score meaningfully in either direction.
The 5% weight reflects the research: a 2019 study in the American Journal of Sports Medicine found that pitchers with minor league IL stints had modestly elevated MLB injury rates, but with smaller effect sizes than most people assume. Real signal, small weight.
The Formula
Raw Score = (IL_severity × 0.30) + (availability × 0.25) +
(recurrence × 0.20) + (pos_load × 0.10) +
(age_at_IL × 0.10) + (pre_milb × 0.05)
All six factor scores run from 0 to 100. The weighted composite maps to the 1–99 output range.
The Career Data Discount
Before the model outputs a final score for players under 27, it applies what I call the Career Data Discount (CDD).
A 23-year-old with a clean injury record hasn’t *earned* a low score — we simply don’t have enough career data to know whether he’s genuinely durable or just hasn’t been injured yet. Those are different things, and conflating them produces overconfident projections.
The CDD compresses scores toward 38 — the model’s uncertainty midpoint — according to how much career data exists:
- Age 22 or under: 60% confidence (score moves 40% toward 38)
- Age 23–24: 65% confidence
- Age 25: 75% confidence
- Age 26: 85% confidence
- Age 27+: No adjustment
The compression works symmetrically. A very low raw score at 23 gets pulled upward toward uncertainty. A high raw score at 23 gets pulled downward. Paul Skenes — NL Cy Young winner, no IL history — has a raw score around 20 that the CDD adjusts to 35. One elite healthy season at 23 is not the same as a decade of demonstrated durability.
Why Post-2010 Only
One of the first decisions in building the model was restricting data to the post-2010 period. This requires explanation because it feels like throwing away information.
Sports medicine eras are not methodologically comparable. The way injuries were treated, documented, and disclosed in 1985 is different enough from 2015 that pooling the data creates more noise than signal. Specifically:
The first Tommy John surgery happened in 1974. Structured rehabilitation protocols became standard in the 1980s and 1990s. Upstream injury prevention — pitch count rules, load management, motion capture — emerged in the 2000s. Biometric monitoring and Statcast-level biomechanics arrived after 2015.
A pitcher who “had arm trouble” in 1988 and a pitcher with a documented partial UCL tear in 2018 are not the same data point.
Post-2010 is the boundary where treatment environments, documentation standards, and disclosure norms become sufficiently comparable to pool into a single analysis.
Notable Team Win Total Findings
Adding the injury risk to a composite of predictive rankings gave me a predicted win total for teams. I then compared these with published win-total lines.
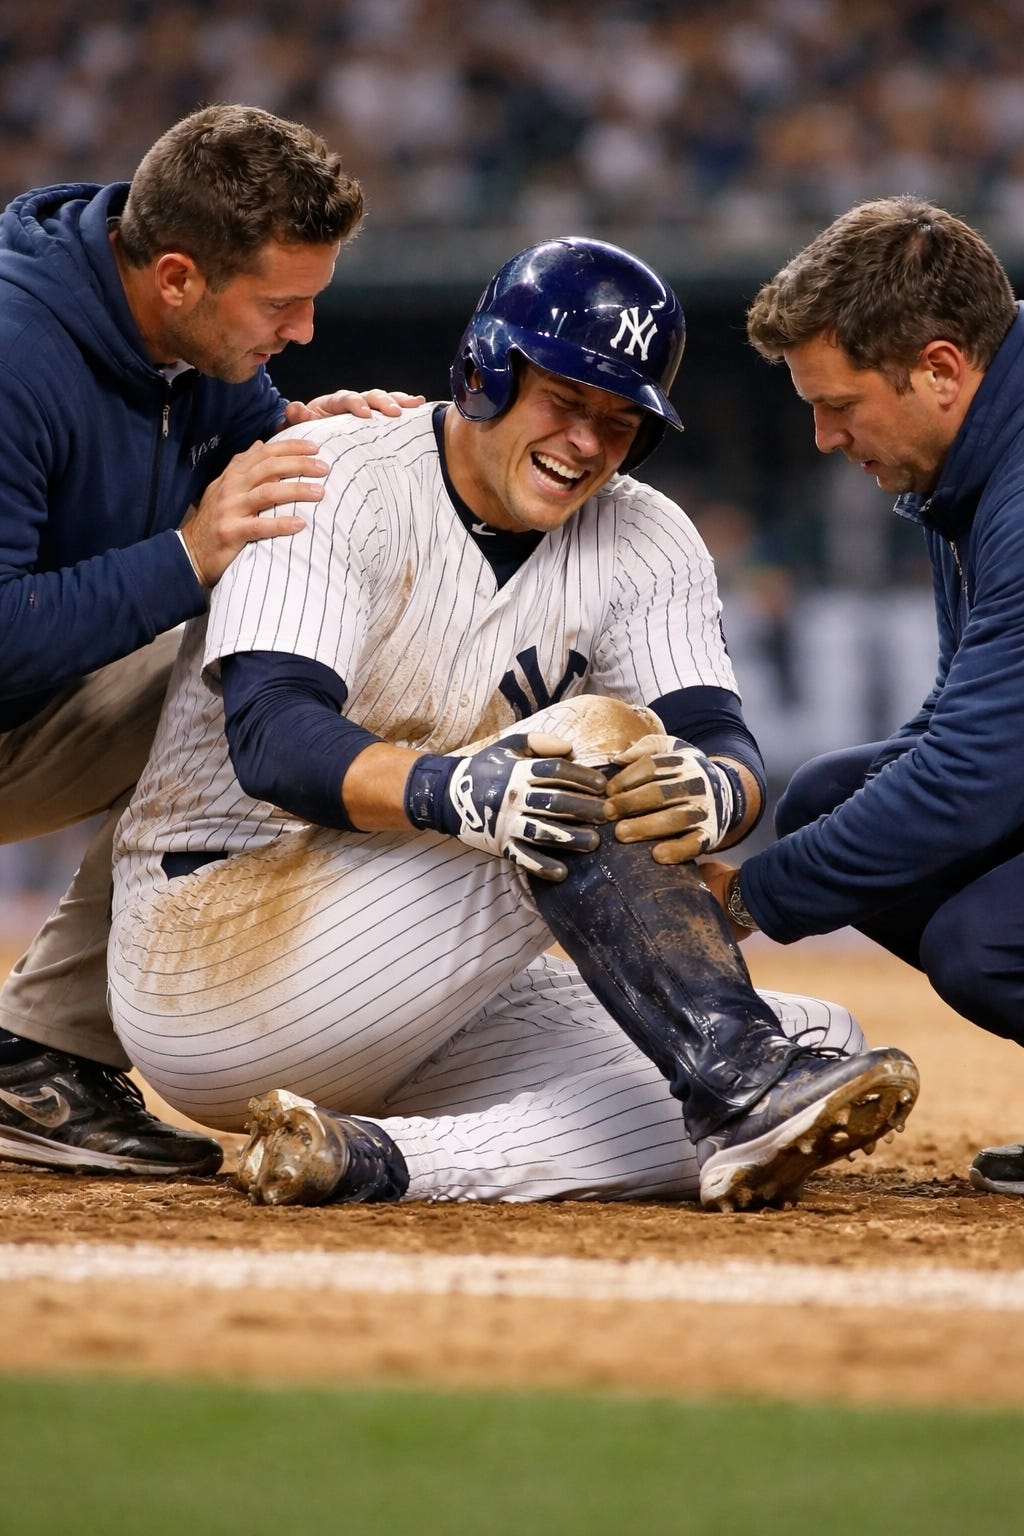
The Yankees are the highest-risk contender in baseball.
Average team injury score of 72. Gerrit Cole opens on the IL recovering from Tommy John surgery — expected return late May at the earliest. Carlos Rodón had elbow surgery and returns late April. Anthony Volpe had shoulder surgery and returns in May. Giancarlo Stanton projects for approximately 32 missed games. Aaron Judge projects for approximately 18.
The book has the Yankees at 91.5 wins. That line is built on an assumption of reasonable availability that the injury record doesn’t support. The model projects 88 injury-adjusted wins. The gap between 90.5 and 88 is the under.
The Dodgers’ 102.5 win total is the most aggressive line in baseball — for the third straight year.
They’re the best team in baseball and they might win 103 games. But three players open on the IL — Blake Snell, Gavin Stone, Tommy Edman — and Tyler Glasnow and Kyle Tucker both carry meaningful projected absences. The model projects 91 injury-adjusted wins. That’s a 12.5-game gap. Even accounting for the Dodgers’ extraordinary depth, 103.5 requires almost everything to go right.
The Giants and Guardians are the most legitimately low-risk competitive rosters.
Logan Webb has led MLB in innings pitched three straight years and is making his fifth consecutive Opening Day start. Jose Ramirez is one of the most consistently available stars in baseball (although a relatively minor shoulder injury prematurely ended his spring training). Both teams are being priced conservatively (Giants - 83 injury-adjusted against a win total of 79.5; Guardians - 85 injury-adjusted against a win total of 82.5) relative to what the model says about their health and underlying quality.
Individual Players
Here are the top 5 players with the highest injury risk who are not currently injured:
Byron Buxton — MIN — CF
Giancarlo Stanton — NYY — DH
Aaron Judge — NYY — RF
Royce Lewis — MIN — SS
Ketel Marte — ARI — 2B/OF
Here are the 5 players with the lowest injury risk:
Logan Webb — SF — SP
Yordan Alvarez — HOU — DH/LF
Mookie Betts — LAD — SS
Freddy Peralta — NYM — SP
Jose Ramirez — CLE — 3B
What’s Next
This is issue one of Into the Corn. Every issue takes a specific moment on the sports calendar and asks the question that rigorous analysis can answer better than conventional coverage does.
The injury model is the first demonstration. The methodology it embeds is the constant. The questions change. The approach doesn’t.
Into the Corn is methodology-forward sports analytics. Hard questions. Serious models. Anchored to the sports calendar.
If you found this useful, share it with someone who takes sports analytics seriously. If you found something wrong with the methodology, tell me — that’s how the model gets better.